 搜索
搜索

利用数码相机和成像光谱仪估测棉花叶片叶绿素和氮素含量
2013-06-08 17:39:06 益择发布王方永1 王克如1,2 李少昆1,2,* 陈 兵1 陈江鲁1
1 新疆兵团绿洲生态农业重点开放实验室 / 新疆作物高产研究中心, 新疆石河子 832003; 2 中国农业科学院作物科学研究所 / 农业部作物生理生态与栽培重点开放实验室, 北京 100081
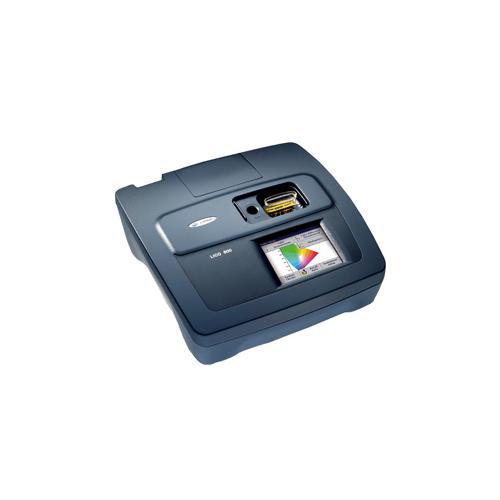
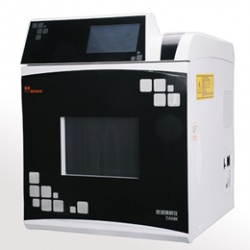
摘 要: 实时、无损监测棉花叶片的叶绿素和氮素含量对诊断棉花生理状况和氮肥精确管理具有重要意义。本研究基于MSI200成像光谱仪和数码相机2种可见光传感器, 分析和比较了光谱和颜色参数与叶绿素、氮素浓度和SPAD读数的关系, 并且确立了其定量预测模型。结果表明, 不同传感器对叶绿素和氮素最敏感的波段分别为R710和R; 光谱指数与叶绿素、氮素浓度和SPAD读数的相关性比原始光谱好, 而且以蓝光和红光波段组成的差值指数(DI和R–B)的预测能力最佳; DI所建棉花叶片Chl a+b、Chl a、Chl b、N和SPAD读数的预测模型的预测误差分别为0.0058、0.0050、0.0018和2.3002 mg g–1和4.9736(分别为均值的18.39%、19.47%、30.33%、11.69%和8.45%), 预测精度R2分别为0.7965、0.7582、0.6608、0.7019和0.7338; R–B所建模型的预测性比DI差, 对Chl a+b的预测精度最高(R2=0.7400), 而预测Chl b的精度最低(R2=0.5653)。基于CIE 1976 L*a*b*颜色模型的颜色参数b*和HSI颜色模型的S是2种传感器与叶绿素、氮素浓度和叶色关系较好的颜色参数; b*对叶绿素、氮素浓度和SPAD读数的预测能力稍逊于DI, 预测误差和精度都与DI的比较接近; 而饱和度S值的预测RRMSE最大, 整体预测精度小于0.62。因此, 可以利用可见光成像传感器的光谱和颜色参数估测棉花叶片叶绿素和氮素含量。
关键词: 棉花叶片; 光谱指数; 颜色参数; 叶绿素; 氮素; SPAD读数
Estimation of Chlorophyll and Nitrogen Contents in Cotton Leaves Using Digital Camera and Imaging Spectrometer
WANG Fang-Yong1, WANG Ke-Ru1,2, LI Shao-Kun1,2,*, CHEN Bing1, and CHEN Jiang-Lu1
1 Key Laboratory of Oasis Ecology Agriculture of Xinjiang Construction Crops / The Center of Crop High-yield Research, Shihezi 832003, China; 2 Institute of Crop Sciences, Chinese Academy of Agriculture Sciences / Key Laboratory of Crop Physiology and Production, Ministry of Agriculture, Beijing 100081, China
Abstract: Leaf chlorophyll and nitrogen concentrations of cotton (Gossypium hirsutum L.) are important indicators of plant N status. They can provide valuable insights into the physiological performance of leaves. The objectives of this study were to de-termine the relationships between chlorophyll, nitrogen, SPAD readings and leaf spectral and color parameters in cotton. Spectral and color parameters for the non-destructive estimation of chlorophyll, nitrogen contents and SPAD readings were obtained by using digital camera (Olympus C-5060) and imaging spectrometer (MSI200) so a wide range of them was established in cotton. The dataset was separated into two parts using for calibration (n=100) and validation (n=60), respectively. Therefore, a systematic analysis was undertaken on quantitative relationships of chlorophyll, nitrogen, SPAD readings to major spectral indices, such as the ratio index (RI), normalized difference index (ND) and difference index (DI), composed of any two wavelengths with original reflectance and color parameters. The results indicated that the maximum sensitivity of reflectance to variation in chlorophyll, nitrogen contents and SPAD readings was found in the far-red wavelength region at 710 nm and in the red wavelength region (R) for two sensors, respectively. Furthermore, spectral indices could improve the prediction ability obviously, and difference indices (DI and R-B) of different sensors composed of blue and red wavelengths gave a better prediction performance. The models to retrieve chlorophyll, nitrogen contents and SPAD readings using DI were the most feasible models with the maximum determina-tion coefficients (R2) and the minimum RMSE, especially, DI (R440, R710), DI (R440, R710), DI (R420, R710), DI (R420, R720) and DI (R490, R710) were the optimum indices for the models of chlorophyll a+b, chlorophyll a, chlorophyll b and N, and SPAD readings, respectively. RB was the optimum index of digital camera but its prediction performances were lower than these of DI. Addi-
相关阅读
暂无评论
- 网友评论:
- 已有0条评论


